What we do
Find the work worth improving.
Then make it work.
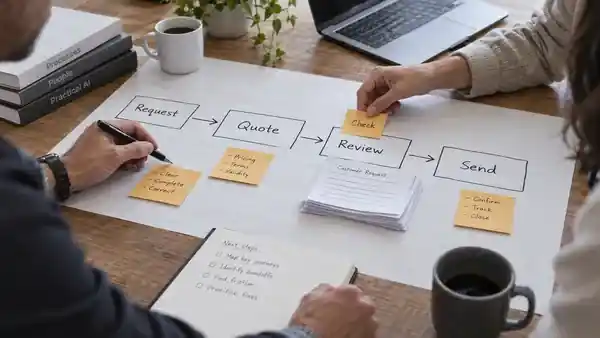
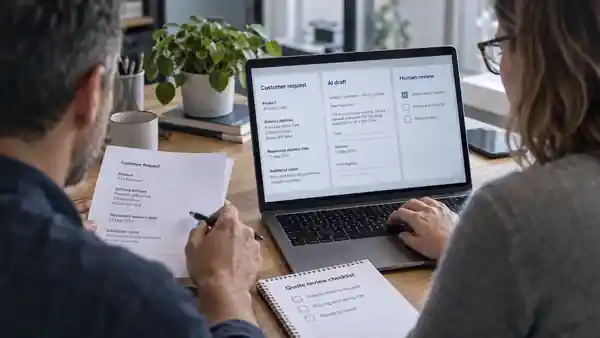
We find where work gets stuck, test useful changes, and help your team put them to work.
Request a free workflow review30 minutes. One workflow.
A useful next step.

Choose a stage to explore
Count the whole task.
Expected Count drafting and review together.Use your own inputs
8 minutes released per task.Capacity, not guaranteed cash savings.
Choose the help you need
Start small.
Decide at every step.
The Diagnostic stands alone. A pilot, implementation, or training is a separate scope.

Work directly with Dr Zak Ouzzif
Careful thinking.
Practical follow-through.
Experience with critical defense systems informs how we test changes and manage risk. Research helps us question assumptions before you invest.
See how we work →See when the change pays for itself.
Expected Whole-task payback lands in Q3.
Payback in Q3.$1,466.67 capacity released this year. Illustrative model — capacity, not cash.
- Q1
- $1,916.67 / $2,750.00
- Q2
- $3,833.33 / $3,900.00
- Q3
- $5,750.00 / $5,050.00
- Q4
- $7,666.67 / $6,200.00
Use your own inputs
Assumes steady workload, Q1 rollout and one labor rate; changed time includes review. Replace the illustrative effort with your own; assess fees and quality separately.
See what AI adoption needs.
Expected Illustrative working assumptions; adjust to your task.
- Business value
- 3 rating / 5
- Available data
- 2.5 rating / 5
- Human review
- 4 rating / 5
- Full costs
- 3 rating / 5
- Team ownership
- 3.5 rating / 5
Change the inputs
From question to working capability.
Expected Illustrative working assumptions; adjust to your task.
- 1
- 2
- 3
- 4