Constructed example · not a client result
Example technical assessment.
Focus on four modules before funding a wider rebuild.
Range per year; central estimate $323k.
Engineering effort per year, not calendar delay.
Engineering effort for the ranked options.
Constructed estimates, not client results or predictions. Hours released represent capacity, not automatic cash savings.
Constructed example, not client results. The full map and supporting records are below.
Where to focus.
Locate concentrated effort.
ExpectedExact values
Confidence by source.
ExpectedExact values
Constructed example: cost drivers.
Build up the cluster cost.
ExpectedExact values
Test the estimate range.
ExpectedExact values
What to fund first.
| Candidate | Excess addressed | Est. effort | Payback | Call |
|---|---|---|---|---|
| Re-partition A│B boundary | 41% | 60 d | 0.45 yr | Fund first |
| Extract shared state, module C | 23% | 45 d | 0.61 yr | Fund |
| Interface contract, C│D | 14% | 30 d | 0.66 yr | Fund if capacity |
| Consolidate module F internals | 6% | 55 d | 2.8 yr | Do not fund |
Review the constructed sequence.
ExpectedExact values
Inspect the full evidence.
The specimen program
Constructed case: a mid-size control platform in a larger engineering program.
| Reference | SPECIMEN-01 |
| Assessment scope | 18 modules · 240 documented interfaces |
| Trailing change effort (12 months) | 1,200 engineering days |
| Assumed fully-loaded day rate | $650 |
| Integration cycles per year | 4 |
| Source access | Read-only, 11 of 18 modules |
| Illustrative elapsed time | 3 weeks in this specimen; not a service-duration promise |
Modules use letters; I and O are omitted to avoid confusion with digits.
Cost, schedule, and confidence
Focus on four modules before funding a wider rebuild.
Four modules (22%) carry 62% of cross-boundary interfaces and absorbed 71% of last year’s change effort. Three sit on the integration critical path.
Comparable changes within this organization took 2.4× the effort in the more-connected cluster.
What it costs
- Cluster change effort
- 852 days
- Internal baseline: 852 ÷ 2.4
- 355 days
- Modelled excess per year
- 497 days × $650 fully loaded = $323,000 / yr
- Estimated annual rework
- $323k
68% of excess—338 engineering days per year—falls on critical-path work; elapsed delay depends on staffing and sequencing.
Confidence in the estimate
Missing module-level effort attribution drives the $262k–$363k range. Recording it could narrow uncertainty.
Records and available source inform the assessment; it does not replace certification or qualified reviewers. Implementation is separately scoped.
Evidence coverage and confidence
Coverage and confidence are reported separately; gaps stay visible.
| Evidence class | Coverage | Confidence | Gap |
|---|---|---|---|
| Interface control documents | 240 / 240 | 91% | 28 not at current revision |
| Change and defect history | 14 months | 86% | Not attributed per module |
| Source verification | 11 / 18 modules | 64% | 7 modules documentation-only |
| Design review records | 4 cycles | 82% | Cycle 2 minutes incomplete |
| Effort attribution | Program level | 48% | Dominant source of band width |
| Practitioner interviews | 6 | 78% | Supplier-side not represented |
Classification and cost estimates need separate checks.
The classifier study covers 141 aerospace test-and-evaluation documents: F1 0.82, Cohen’s kappa 0.84. The separate 35-person expert survey is practitioner feedback, not the population behind those scores.
These scores do not validate financial estimates, client outcomes, or applicability beyond the studied program.
Ouzzif, Zakaria, WPI doctoral dissertation, May 2026: classifier §4.1.1/Table 4.1 (pages 39–40); survey §4.3 (pages 47–56); limits page 62.
Inspect this specimen’s cost assumptions or the worked evidence example.
Sensitivity
The range shows which assumptions change the estimate most.
| Assumption | Range tested | Exposure | Influence |
|---|---|---|---|
| Coupling multiplier | 1.9 – 2.9 | $262k – $363k | Dominant |
| Attributable share of effort | 64% – 76% | $291k – $346k | Moderate |
| Fully-loaded day rate | $580 – $720 | $288k – $358k | Linear, low uncertainty |
| Attainable improvement | 50% – 85% of excess | $162k – $275k recoverable | Dominant on the return side |
Agree acceptable payback separately; these ranges test assumptions, not funding thresholds.
Scope of this assessment
- No certification. Applicable criteria may include DO-178C, AS9100, MIL-STD-882, ISO 26262 or IEC 62304; no accreditation or replacement for a DER, auditor or safety assessor.
- A point-in-time measurement. After two or three integration cycles, treat figures as indicative; coupling changes.
- Documentation limits the result. Seven of eighteen modules are documentation-only; the map flags unverified implementation.
- Causality remains unproven: Coupling and effort are associated; complexity, team experience, and requirement volatility may also explain the pattern. Establishing causality requires a controlled experiment.
- No prediction of your outcome. Recoverable benefits are assumptions-based estimates, not promised removal of excess effort.
The program, figures, and decisions are constructed, not a client engagement or result.
Inspect the cost calculation, sensitivity assumptions, and interactive worked example.
System design debt map
Each connection traces to an interface record or observed change.
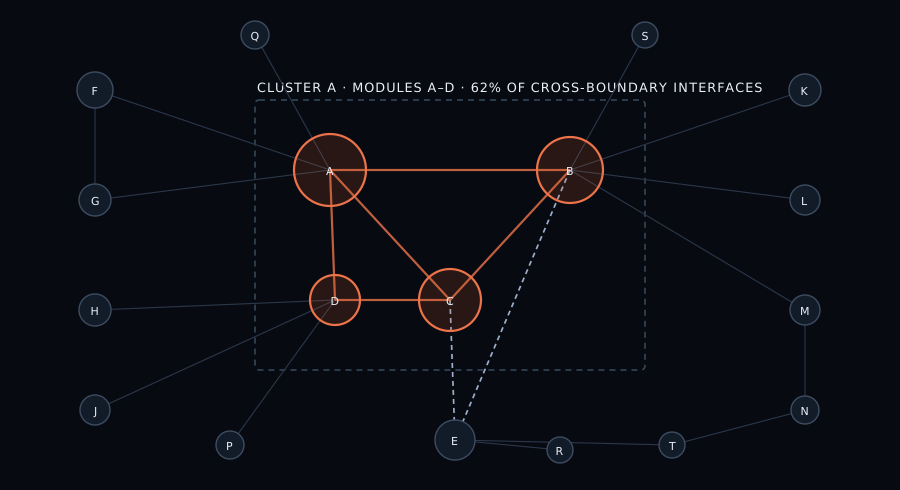
18-module coupling map.
Node radius shows trailing-year effort; Cluster A contains A–D.
Module register
| Module | Cross-boundary interfaces | Change effort (days) | Critical path |
|---|---|---|---|
| A | 46 | 268 | Yes |
| B | 41 | 231 | Yes |
| C | 38 | 205 | Yes |
| D | 24 | 148 | No |
| E | 13 | 46 | Yes |
| F | 10 | 38 | No |
| G | 8 | 34 | No |
| H | 8 | 31 | No |
| J | 7 | 28 | No |
| K | 7 | 26 | No |
| L | 6 | 24 | No |
| M | 6 | 22 | No |
| N | 5 | 20 | No |
| P | 5 | 19 | No |
| Q | 5 | 18 | No |
| R | 4 | 16 | No |
| S | 4 | 14 | No |
| T | 3 | 12 | No |
| Total | 240 | 1,200 | — |
Cluster A: 149/240 interface endpoints (62%); 852/1,200 change days (71%).
Principal findings
The densest pairing has 31 interfaces; same-cycle changes on both sides account for 41% of measured excess.
Evidence: interface control documents, 14 months of change records, and source in both modules.
Disputed ownership required cross-team coordination in 62% of cycles versus the 11% program median.
Evidence: change records, review minutes, four interviews.
An unversioned contract relies on convention and testing: 14% of excess, with disproportionate late-cycle defects.
Evidence: test reports from four integration cycles.
Three of six interviews flagged F’s poor code; it changes twice yearly, off the critical path.
At 65% recovery: 6% of excess, 55 days of work, 2.8-year payback.
Do not fund; record the reason, owner, and review date.
Accept F’s debt; prioritize stronger candidates.
Ranked action plan
Illustrative payback = upfront days ÷ (497 excess days/year × candidate share × 65% recovery); equal day costs, immediate benefits, no ongoing costs.
At 65% recovery, the top three address 78% of excess for 135 engineering days, with payback inside eight months.
Illustrative rollout and review sequence
Illustrative timing; agree dates and ZOYA implementation separately, or deliver the plan internally.